We live in a talent economy and now more than ever, companies are realizing that with great people comes great business success. With the rise of 'Great Place to Work' contests and the popularity of LinkedIn, HR departments have gained significant strategic importance over the past few decades. Companies have recognized that when they have a well-balanced and happy employee base, this reflects in every other part of the business.
But how do we get to such a base?
Imagine being the HR Director of a company with over 20.000 employees. You have the unsettling feeling that a lot of employees are starting to leave your company, but you’re not sure why. You try to look at reports from exit interviews and after having read through 100s of them, it looks like there is no clear trend in the reasons for leaving. All these exits have one thing in common though: they could have been prevented.
When trying to understand what dynamics are in play with a large group of people, I tend to turn towards the data to try to make sense of it all. This has been proven to work well in many other parts of the business, like marketing and finance, so why not apply this to HR as well?
Retention analytics
One of the ways in which we can use our HR data is to predict who is going to leave the company when. By comparing your 'loyal' base to the ones that have left your organization deliberately in the past (using predictive modeling techniques), you can spot the main differences between the two and see at which point in their careers people tend to leave and what the probable causes could be.
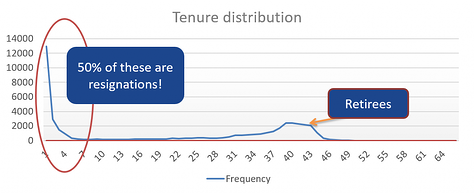
For example, the below graph depicts tenure or years of service over time for past employees. It’s immediately clear that people with less than 4 years of service have a high probability of leaving the company, either voluntarily or involuntarily. This information can help you in setting your target for predictive modeling: the people who resign in the first 4 years are your target when modeling for employee churn.
Example of employee tenure frequency distribution
Now we can take a look at a number of variables to predict this target. You might notice that there are people who take sick leave frequently and that this is a pattern that returns in the period before a resignation. You should read this as a call to action to check in on an employee when you see a significant increase in sick day frequency.
Or you could monitor external data like job popularity or vacancy information. Doing so, you might be able to pick up on the fact that someone's position is becoming increasingly popular. This then is your cue to make sure those people are and stay happy before your competitor comes in and swoops them away. For example, I know of a pharmaceutical company that is already identifying "high-flight-risk" candidates among their high-potential employees by collecting data from LinkedIn and other social media networks.
You could even build a social network of your employees by looking at e-mail frequency, for instance, to detect crucial nodes in your employee network. When crucial nodes resign, people that are 'close' to them in a social network have a very high probability of leaving too.
Hiring for success
Retention analytics can help to ensure that your good people stay with you. But how about attracting new good people? What makes a good employee and how can you purposely set out a hunt for them? The idea is similar to the one explained above: look for good employees and compare them to the not so good ones, using data that you can collect right up until the hiring date. You might rightfully think “What data can I possibly have about a person before hiring them?”.
Here is your chance to be creative. Apart from demographic data, education and previous work experience, you can collect information on candidates by conducting structured interviews, similar to interviews used in qualitative research. These interviews would contain exactly the same questions for each candidate and post hoc you could then compare answers of your good employees and extrapolate these insights for new candidates.
An added benefit is that you can tailor the questions suited to your business. A high-tech company developed an analytics model that predicted whether employees were likely to become "toxic" (liars or cheaters) and reduced this population amongst hires significantly by adding and analyzing special parts in the interviewing process.
After analyzing this data, a lot of traditional beliefs might be thrown out the window. An insurance company, for instance, analyzed the profiles of top salespeople and discovered that high-grade point average or academic success was not a strong indicator of sales performance in the future. Interesting things that did matter, though, were the typos, errors and grammatical mistakes in their resume and the fact of whether or not they had experience in selling real estate or cars.
Another option for collecting data about your candidates before their hire date could be to look at external data like LinkedIn or Twitter. This data can be structured or unstructured (most probably free text).
For an example on how to use unstructured or free text in analytics, please see one of our earlier blog posts on text mining: How analytics can help you uncover the knowledge hidden in your documents.
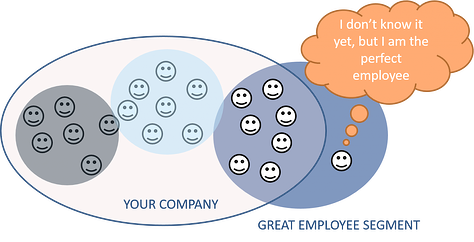
Using the data, you collected from people already inside and still outside your company, measured right up to the hiring date, you could conduct a segmentation analysis and identify your 'great employee' segment: people that are not yet in your company but are in said segment are perfect candidates to pursue.
Possible employee clustering application
Using HR Analytics to Counter Absenteeism
As stated in a Forbes article, costs of absenteeism have been estimated to be around $3000 a year for each employee. These costs are extremely high and are caused by lost productivity, poor quality of goods and services, excess admin time plus a decline in morale for the entire company.
Absenteeism is already measured quite extensively in most companies and is usually a major KPI for HR. The reasons for absenteeism, though, are manifold and hard to determine. They can be either legitimate or poor excuses for missing work, they can be due to bullying in the workplace, burnout, childcare, depression, illness ...
Analytics can be a great way to start countering absenteeism by attempting to find the underlying reasons. When we start to analyze the data, we’d be able to put measures in place that can help your company move towards a lower absenteeism figure.
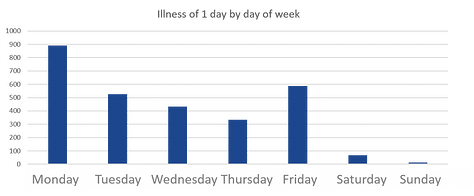
For example, you might find that people often take a 'sick' day on Mondays. If you dig deeper, you might find these people are usually single mothers and the Mondays on which they are not at work tend to be Mondays after a holiday period. This might indicate that these specific people are just having a hard time getting their 'ducks in a row' on a particularly busy Monday morning. Solutions for this problem might be to allow them to come in two hours later on these days but have them work half an hour later for the rest of the week.
Another application of this could be directed medical controls. Medical controls can be a big cost for companies when checking up on employees who stay home sick. If there was a way to estimate someone's probability of not actually being sick, these controls could be better informed and directed. Instead of choosing people to visit at random, directed medical controls can ensure that you visit the 'riskiest' employees first.
But just knowing that some days have a higher absenteeism probability will also allow you to account for this in planning. Automobile companies are already studying the underlying patterns of unplanned absences to predict when people are likely to take a day off and then schedule extra staff ahead of this to make up for these known periods of absence.
Illustration of employee 'illness of 1 day' by day of week
So where do you start?
A lot of companies already sit on top of an enormous amount of HR information that is full of potentially valuable insights. Think about legacy HR and planning applications or off the shelf HRM products like PeopleSoft. Other possible sources of information could be badging hours, user logins from home, email traffic, external data, data collected during interviews, performance review data, background check data ... Your company may already be doing analytics in some form or way and you could leverage this expertise and these tools.
One thing to keep in mind while on your quest through HR analytics is privacy and security. As an employer, you obviously have access to a great deal of personal information, and evidently, your employee has certain rights to protect his privacy as well. In many cases, you can anonymize your data to just detect certain trends and gain insight. When you are modeling and applying that model to individuals or collecting specific personal data (external or through interviews), you need to be a bit more careful. If you would like to read up on the legislation, please see the privacy commission website.
The value of HR analytics can be quickly proven by doing a small proof of concept, focusing on business priorities. The key here is to think big but act small, like with any other analytical project. It is better not to overanalyze and perfect your analytics setup, but to let the data guide you to the value.
We see analytics projects failing because they have been set up too ambitiously at the start, eager to use all of the available data, making sure that data is perfect before starting analyses. However, what we notice in many of our projects is that an agile approach, trying to create value as soon as possible, is a great way to scratch the surface to discover what might be hidden in your data. This way, you can make an informed decision on where to focus your efforts on a next iteration.
After a few of these proof of concepts, you will have a better idea of the value of HR analytics and which application areas are most crucial for your business. Once you’ve established where the value lies, you can start putting in place measures to perform these analyses and apply these models going forward.
This is where things like data quality, data governance, ICT architecture, business processes and change management come into play, as well as operationalizing your analytics insights to create even more value.
Conclusion
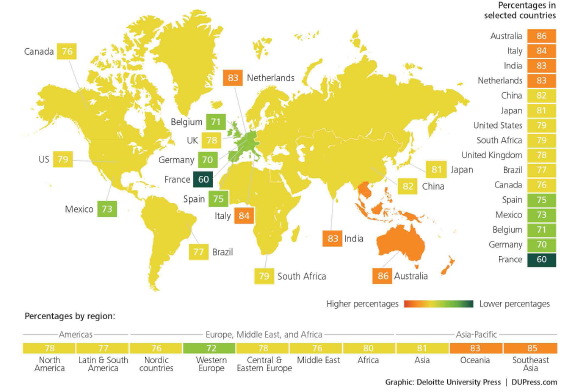
People analytics is gaining momentum. HR departments across the globe are realizing that data is the answer to solving questions about why people join, stay or leave a company. As stated in Deloitte's Human Capital Trend report, Belgium still needs some convincing compared to the rest of the world, but undoubtedly will soon catch on as well.
Percentage of respondents rating People Analytics as an 'important' or 'very important' trend.
Global appreciation for people analytics per Deloitte's Human Capital Trend report.
We have given a brief overview of some of the possibilities of HR analytics. However, there are many more application opportunities to be explored and companies like Google are leading the way. Hopefully, you have found some inspiration to start your own journey in analytics on the valuable HR data located within your company.
If you would like to talk to an experienced partner or need someone to help you get started, don't hesitate to contact us.


